


QC Report for: GI25009_10483403
This is a MultiQC report generated from samples in the project GI25009_10483403.
- All 6 samples show consistent and high-quality metrics with no major QC issues.
31_Anolis334_M2A_10483403_22YNTGLT4_L8 and33_Anolis334_M2JR_10483403_22YNTGLT4_L8 exhibit moderately elevated duplication rates (54.89% and 55.76%, respectively), but remain within acceptable ranges for typical sequencing data.
Analysis
-
All samples demonstrate excellent sequencing quality:
- High Q30 scores across all samples (92.01-92.97%)
- Consistent GC content (45.72-46.29%)
- Uniform read lengths (150 bp for both R1 and R2)
- High percentage of reads passing filter (93.54-94.75%)
- Low adapter contamination (4.31-5.68%)
-
Duplication rates vary across samples:
31_Anolis334_M2A_10483403_22YNTGLT4_L8 (54.89%) and33_Anolis334_M2JR_10483403_22YNTGLT4_L8 (55.76%) show moderately elevated duplication32_Anolis334_M2J_10483403_22YNTGLT4_L8 (49.11%),34_Anolis2_M2A_10483403_22YNTGLT4_L8 (48.76%), and36_Anolis2_M2JR_10483403_22YNTGLT4_L8 (45.53%) show acceptable duplication levels35_Anolis2_M2J_10483403_22YNTGLT4_L8 shows the lowest duplication rate (39.58%)
-
Sequencing depth varies significantly across samples:
32_Anolis334_M2J_10483403_22YNTGLT4_L8 has the highest coverage (942.4M reads)34_Anolis2_M2A_10483403_22YNTGLT4_L8 has the lowest coverage (295.9M reads)- This variation appears intentional based on sample naming (M2A vs M2J vs M2JR tissue types)
Recommendations
- Proceed with downstream analysis for all samples - no samples need to be excluded.
- The moderately elevated duplication rates in
31_Anolis334_M2A_10483403_22YNTGLT4_L8 and33_Anolis334_M2JR_10483403_22YNTGLT4_L8 are likely due to library complexity or input material limitations rather than technical failures, and should not significantly impact analysis. - Consider the variation in sequencing depth when performing comparative analyses between samples.
- No adapter trimming is urgently needed given the low contamination levels, though it may be performed as part of standard preprocessing if desired.
- The data quality is suitable for downstream genomic analyses including variant calling, RNA-seq, or other applications.
General Statistics
| Sample Name | % Duplication | % > Q30 | Mb Q30 bases | # Reads | GC content | % PF | % Adapter | Mean R1 Length | Mean R2 Length |
|---|---|---|---|---|---|---|---|---|---|
| 31_Anolis334_M2A_10483403_22YNTGLT4_L8 | 54.9% | 92.7% | 48,218.2Mb | 347,657,542M | 46.2% | 93.5% | 5.7% | 150.0bp | 150.0bp |
| 32_Anolis334_M2J_10483403_22YNTGLT4_L8 | 49.1% | 92.6% | 130,711.4Mb | 942,435,918M | 45.8% | 94.4% | 4.3% | 150.0bp | 150.0bp |
| 33_Anolis334_M2JR_10483403_22YNTGLT4_L8 | 55.8% | 93.0% | 76,567.5Mb | 550,040,834M | 45.7% | 94.4% | 4.4% | 150.0bp | 150.0bp |
| 34_Anolis2_M2A_10483403_22YNTGLT4_L8 | 48.8% | 92.3% | 40,885.3Mb | 295,864,144M | 46.2% | 94.7% | 4.5% | 150.0bp | 150.0bp |
| 35_Anolis2_M2J_10483403_22YNTGLT4_L8 | 39.6% | 92.0% | 93,039.0Mb | 675,485,694M | 46.1% | 94.2% | 4.9% | 150.0bp | 150.0bp |
| 36_Anolis2_M2JR_10483403_22YNTGLT4_L8 | 45.5% | 92.3% | 57,597.7Mb | 416,866,270M | 46.3% | 94.3% | 4.8% | 150.0bp | 150.0bp |
Insert Length Distribution
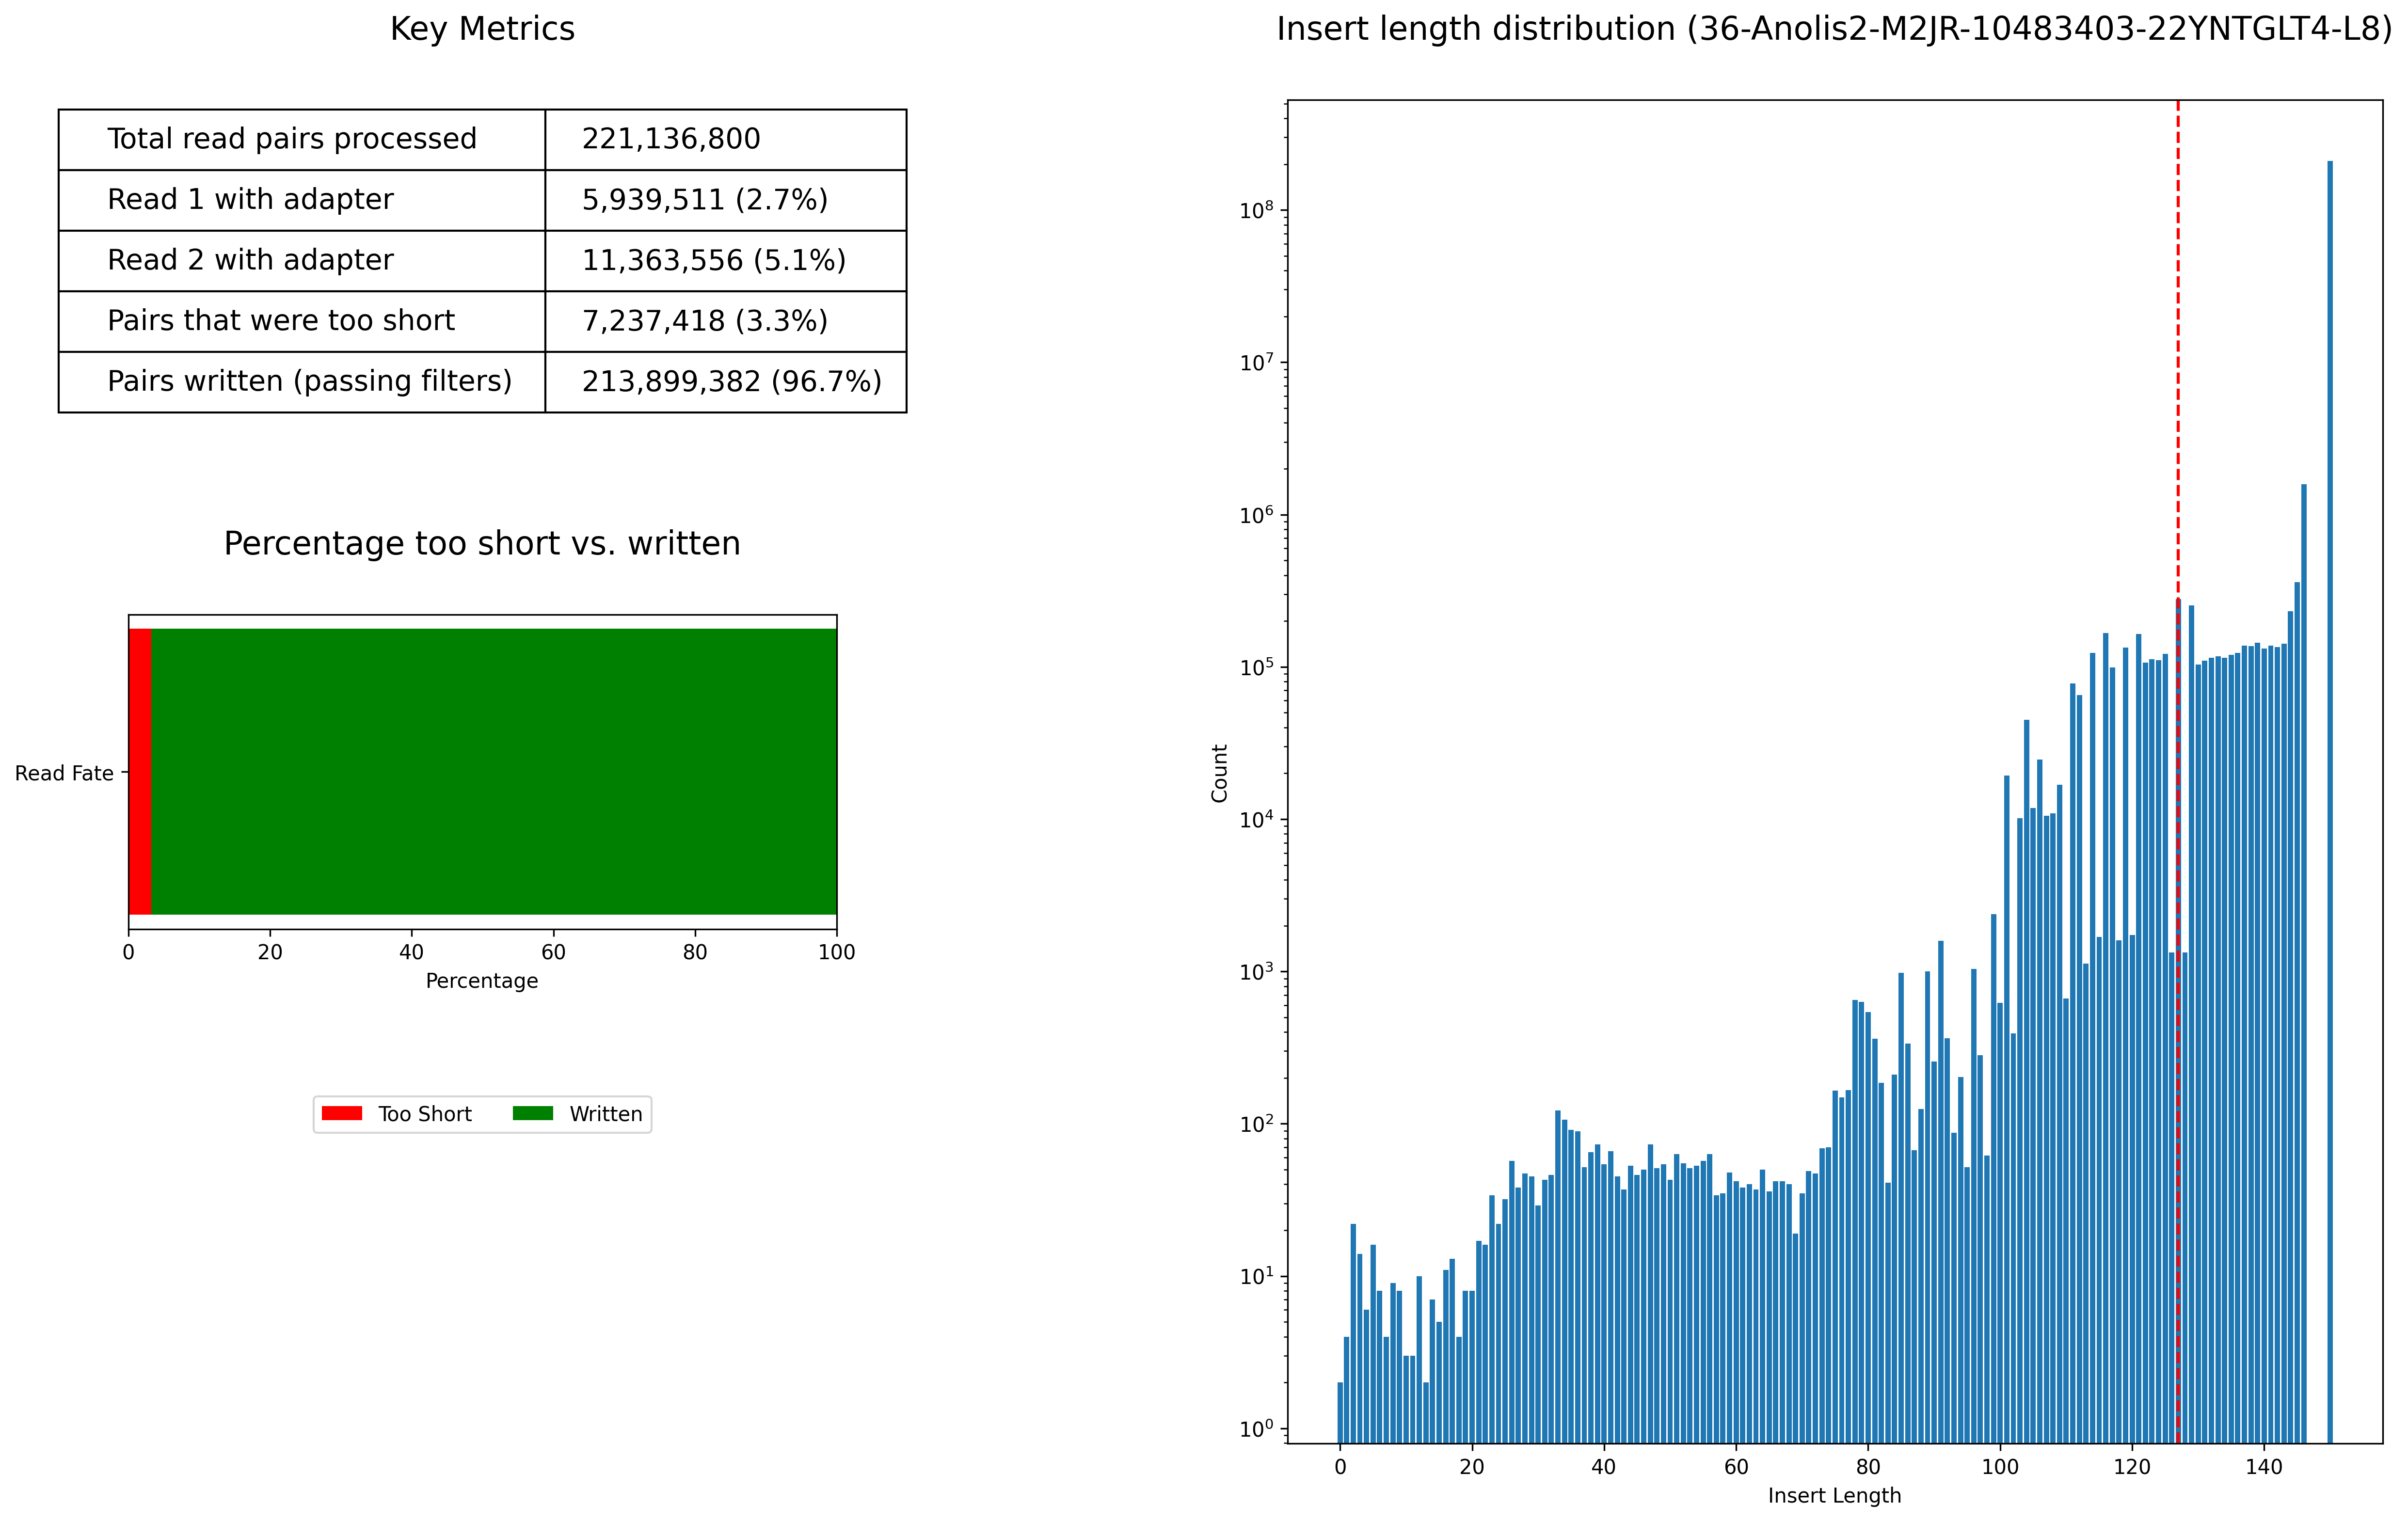
- 36-Anolis2-M2JR-10483403-22YNTGLT4-L8_insert_length_distribution.png
- 31-Anolis334-M2A-10483403-22YNTGLT4-L8_insert_length_distribution.png
- 34-Anolis2-M2A-10483403-22YNTGLT4-L8_insert_length_distribution.png
- 35-Anolis2-M2J-10483403-22YNTGLT4-L8_insert_length_distribution.png
- 32-Anolis334-M2J-10483403-22YNTGLT4-L8_insert_length_distribution.png
- 33-Anolis334-M2JR-10483403-22YNTGLT4-L8_insert_length_distribution.png
fastp
0.23.2
All-in-one FASTQ preprocessor (QC, adapters, trimming, filtering, splitting...).URL: https://github.com/OpenGene/fastpDOI: 10.1093/bioinformatics/bty560
Fastp goes through fastq files in a folder and perform a series of quality control and filtering. Quality control and reporting are displayed both before and after filtering, allowing for a clear depiction of the consequences of the filtering process. Notably, the latter can be conducted on a variety of parameters including quality scores, length, as well as the presence of adapters, polyG, or polyX tailing.Filtered Reads
Filtering statistics of sampled reads.
Software Versions
Software Versions lists versions of software tools extracted from file contents.
| Software | Version |
|---|---|
| fastp | 0.23.2 |
Raw Read 1 Base Content Summary
Summary of base contents for all samples (each bold line is the mean for that base, and the shaded region is the standard deviation).

Raw Read 1 Base Contents
Base contents for individual samples.

- 35-Anolis2-M2J-10483403-22YNTGLT4-L8.read_1_combined_content_plot.png
- 31-Anolis334-M2A-10483403-22YNTGLT4-L8.read_1_combined_content_plot.png
- 34-Anolis2-M2A-10483403-22YNTGLT4-L8.read_1_combined_content_plot.png
- 32-Anolis334-M2J-10483403-22YNTGLT4-L8.read_1_combined_content_plot.png
- 36-Anolis2-M2JR-10483403-22YNTGLT4-L8.read_1_combined_content_plot.png
- 33-Anolis334-M2JR-10483403-22YNTGLT4-L8.read_1_combined_content_plot.png
Raw Read 1 Quality Summary
Summary of quality for all samples (each bold line is the mean for that base, and the shaded region is the standard deviation).

Raw Read 1 Quality
Quality for individual samples.

- 34-Anolis2-M2A-10483403-22YNTGLT4-L8.read_1_combined_quality_plot.png
- 32-Anolis334-M2J-10483403-22YNTGLT4-L8.read_1_combined_quality_plot.png
- 35-Anolis2-M2J-10483403-22YNTGLT4-L8.read_1_combined_quality_plot.png
- 33-Anolis334-M2JR-10483403-22YNTGLT4-L8.read_1_combined_quality_plot.png
- 36-Anolis2-M2JR-10483403-22YNTGLT4-L8.read_1_combined_quality_plot.png
- 31-Anolis334-M2A-10483403-22YNTGLT4-L8.read_1_combined_quality_plot.png
Raw Read 2 Base Content Summary
Summary of base contents for all samples (each bold line is the mean for that base, and the shaded region is the standard deviation).

Raw Read 2 Base Contents
Base contents for individual samples.

- 31-Anolis334-M2A-10483403-22YNTGLT4-L8.read_2_combined_content_plot.png
- 36-Anolis2-M2JR-10483403-22YNTGLT4-L8.read_2_combined_content_plot.png
- 32-Anolis334-M2J-10483403-22YNTGLT4-L8.read_2_combined_content_plot.png
- 33-Anolis334-M2JR-10483403-22YNTGLT4-L8.read_2_combined_content_plot.png
- 35-Anolis2-M2J-10483403-22YNTGLT4-L8.read_2_combined_content_plot.png
- 34-Anolis2-M2A-10483403-22YNTGLT4-L8.read_2_combined_content_plot.png
Raw Read 2 Quality Summary
Summary of quality for all samples (each bold line is the mean for that base, and the shaded region is the standard deviation).

Raw Read 2 Quality
Quality for individual samples.

- 32-Anolis334-M2J-10483403-22YNTGLT4-L8.read_2_combined_quality_plot.png
- 35-Anolis2-M2J-10483403-22YNTGLT4-L8.read_2_combined_quality_plot.png
- 33-Anolis334-M2JR-10483403-22YNTGLT4-L8.read_2_combined_quality_plot.png
- 36-Anolis2-M2JR-10483403-22YNTGLT4-L8.read_2_combined_quality_plot.png
- 31-Anolis334-M2A-10483403-22YNTGLT4-L8.read_2_combined_quality_plot.png
- 34-Anolis2-M2A-10483403-22YNTGLT4-L8.read_2_combined_quality_plot.png
 MultiQC v1.31
- Written by Phil Ewels,
available on GitHub.
MultiQC v1.31
- Written by Phil Ewels,
available on GitHub.
This report uses Plotly, jQuery, jQuery UI, Bootstrap and FileSaver.js.